
Working with MS Word, Excel and Power Point
MS WORD
v Creating & editing word documents,
1.
To create a new blank document:
2.
Click the Microsoft Office button.
3.
Select New. The New Document dialog box
appears.
4.
Select Blank document under the Blank and
recent section. It will be highlighted by default.

Click
Create. A new blank document appears in the Word window.

To create
and design effective documents, you need to know how to format text. In addition
to making your document more appealing, formatted text can draw the reader's
attention to specific parts of the document and help communicate your message.
In this
lesson, you will learn to format the font size, style, and color of text, as
well as how to use the Bold, Italic, Underline, and Change Case commands.
v Formatting text
To format font size:
1.
Select the text you want to modify.
2.
Left-click the drop-down arrow next to the font
size box on the Home tab. The font size drop-down menu appears.
3.
Move your cursor over the various font sizes. A
live preview of the font size will appear in the document.

To format font style:
1. Select
the text you want to modify.
2. Left-click
the drop-down arrow next to the font style box on the Home tab. The font style drop-down
menu appears.
3. Move
your cursor over the various font styles. A live preview of the font will
appear in the document.

To format font color:
1.
Select the text you want to modify.
2.
Left-click the drop-down arrow next to the font
color box on the Home tab. The font color menu appears.
3.
Move your cursor over the various font colors. A
live preview of the color will appear in the document.

1.
Left-click the font color you want to use. The font
color will change in the document.
2.
To use the Bold, Italic, and Underline commands:
3.
Select the text you want to modify.
4.
Click the Bold, Italic, or Underline command in the
Font group on the Home tab.

1.
To change the text case:
2.
Select the text you want to modify.
3.
Click the Change Case command in the Font group on
the Home tab.
4.
Select one of the case options from the list.

v
INSERTING CLIP ART
You may want to insert
various types of illustrations into your documents to make them more visually
appealing. Illustrations include clip art, pictures, SmartArt, and charts.

To locate clip art:
Select the Insert tab.

1.
Click the Clip Art command in the Illustrations
group.
2.
The clip art options appear in the task pane on the
right.
3.
Enter keywords in the Search for: field that are
related to the image you want to insert.
4.
Click the drop-down arrow next to the Search in:
field.
5.
Select everywhere to ensure Word searches your
computer and its online resources for an image that meets your criteria.
6.
Click the drop-down arrow in the Results should be:
field.
7.
Deselect any types of images you do not want to
see.

Click Go.
1. To insert clip art:
2.
Review the results from a clip art search.
3.
Place your insertion point in the document where
you want to insert clip art.
4.
Left-click an image in the task pane. It will
appear in the document.
OR
5.
Left-click the arrow next to an image in the task
pane.
6.
Select Insert, Copy, or any of the other options on
the list.

v GRAPHICS
1.
To insert a Smart Art illustration:
2.
Place the insertion point in the document where you
want the graphic to appear.
3.
Select the Insert tab.
4.
Select the Smart Art command in the Illustrations
group. A dialog box appears.

select a category on the left of the dialog box, and review the SmartArt
graphics that appear in the center.
Left-click a graphic to select it.

Click
OK.
Page
Orientation
Page orientation is the direction in which a
document is displayed or printed. The two basic types of page orientation are
portrait (vertical) and landscape (horizontal). Most monitors have a
landscape display, while most documents are printed in portrait mode.
Before printing a document, you may be able to
change the page orientation by selecting "Page Setup..." from the
program's File menu. The default orientation
is typically portrait, but you can change it to landscape if you want the width
to be longer than the height. This may be useful for printing signs, cards, or
other documents that require a wide display.
Portrait and landscape orientation in Word and Excel
we’re
talking about the Portrait and Landscape orientations in Word and Excel, what
they are, why you might want to use each one, and how to swap between them.
What are Portrait and Landscape?
Portrait and Landscape are the terms used for the orientation
of the page in applications that deal with pages, such as Word and Excel.
Orientation means the relative position of the page when you’re looking at it:
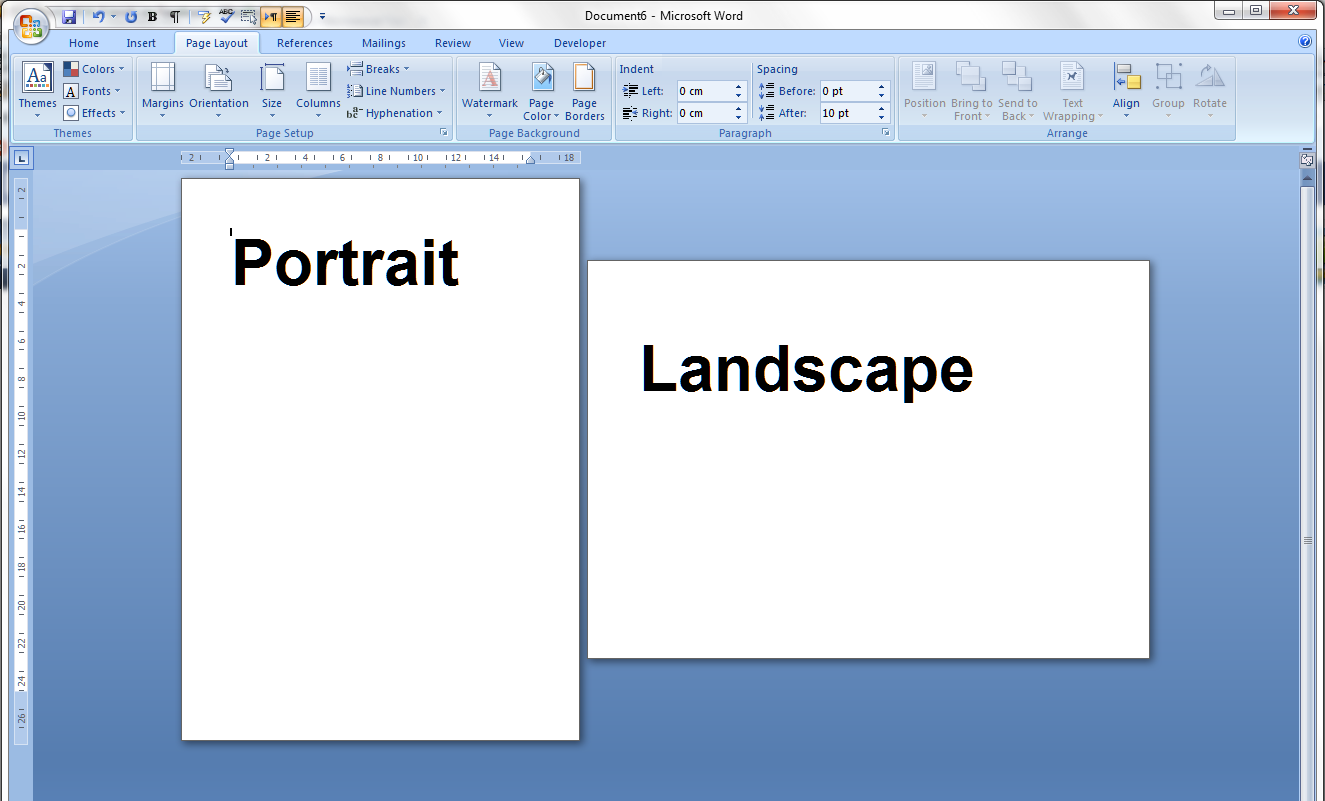
Portrait means that the page has the shorter sides at top and
bottom. Think of a portrait in a gallery or museum. They are usually this way
round. Landscape means that the page has the shorter sides on the left
and right. Again, think of an art gallery. Which way round are views painted of
the landscape? Exactly.
Why would I want to use the landscape orientation?
Word
and Excel documents default to being in the portrait orientation. That’s the
format of most books, reports, folders, etc. But landscape can be very useful
if …
In
Word
- Your
layout is such that it comes out wider than it’s high – maybe a poster or
a sign to put up in your office or building
- You
have a wide table to insert into the document with lots of columns and it
gets too squashed up and hard to read if you try to fit it onto a standard
portrait A4 page
- You
have a diagram to insert into the document that’s wider than it’s high
- You
have a picture to insert into the document that’s wider than it’s high
In
the last three incidences, you might only want one page of the document to
appear in landscape. That’s easily done, and you can find out how to have
portrait and landscape in one document here.
In
Excel:
- Your
spreadsheet is too wide to fit comfortably onto a portrait A4 page
How do you change between Portrait and Landscape in Word
2007 and Word 2010?
You swap
between Portrait and Landscape using the Orientation menu in Word.
This can be found in the Page Layout tab, in the Page Setup section:

Press
the Orientation button (or the little arrow at the bottom) to access the
menu:
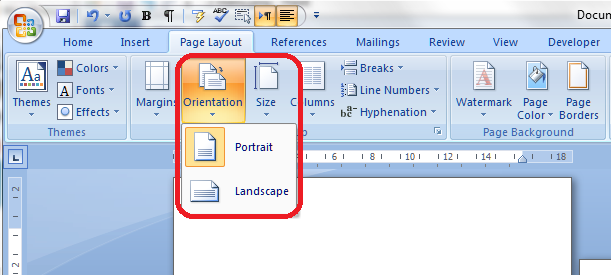
Choose
your orientation, and the whole document will change to that orientation,
unless you’re only changing one section (see below)
How do you change one page in Word to be in Landscape?
To change
one page in Word to be in Landscape, you need to set Section Breaks
first, so that Word knows which pages you want to change. See this post on
Section Breaks for
instructions on how to do this and change just one page or section.
How do you change between Portrait and Landscape in Excel
2007 and Excel 2010?
Changing
the orientation in Excel works in exactly the same way as doing it in
Word. Find the Orientation menu by going into the Page Layout tab
and Page Setup section:
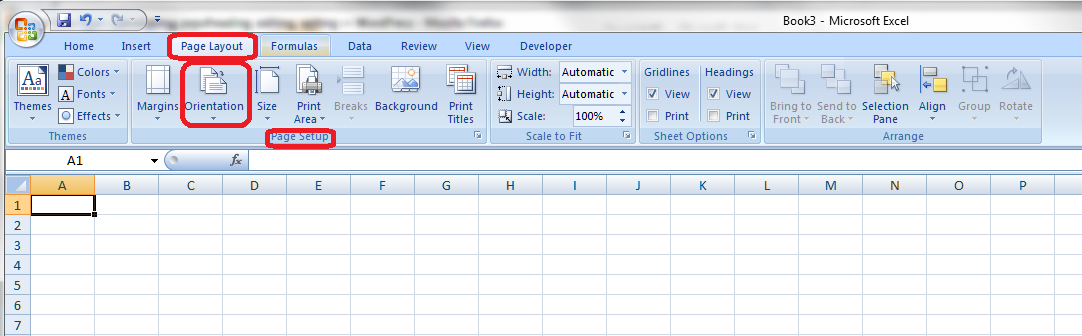
Then
press the Orientation button to make your selection.
How do you change between Portrait and Landscape when you’re
printing?
Sometimes
you don’t realise that you need to print your document in Landscape rather than
Portrait (it’s usually this way around, I find) until you have printed out one
copy and find that your lovely picture or table falls off the edge of the page.
You
can change the orientation of the printing while printing – however, the
orientation of your original document will NOT change if you use this method,
and if you want it to change to Landscape permanently, you will need to go back
and follow the instructions I give above.
If
you want to change the orientation of your printing (in Word or Excel or
when you’re printing off a web page or a map or anything!) …
First,
select the Print option. When the Print dialogue box comes up,
click the Properties button:

You
will usually then be given a screen something like this which will have a Features
tab:
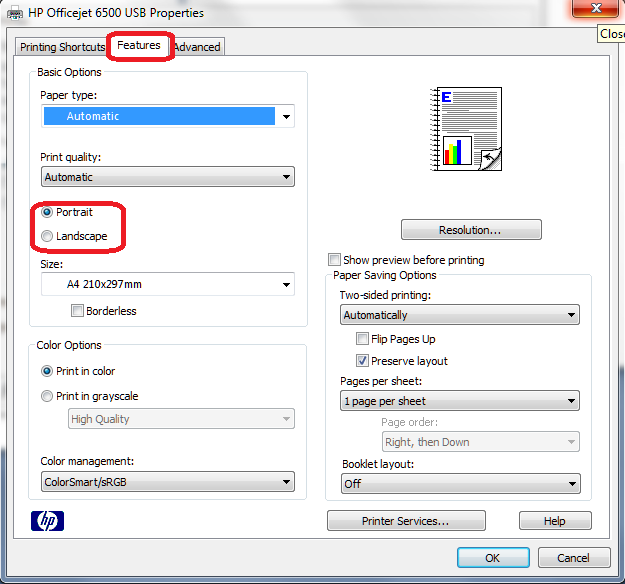
Find
choice buttons for Portrait / Landscape, select the one you want, and OK,
and then your printout will be in that orientation.
In
this article we have learned what the portrait and landscape orientations are,
why they are useful, how to change them in Word and Excel and how to change
orientation when you are printing.
If
you have enjoyed this post, please share the link using the buttons below or
sharing the Face book, Twitter or LinkedIn alert that you followed to get here!
v SETTING UP HEADERS AND FOOTERS
Headers and footers are pieces of text or graphics that appear at the top and
bottom of a page. After you set up a header and footer, they will appear on all
of your pages. You can add a page number to a header or footer, and Microsoft
Word will automatically insert the right page number for you.
To
set up a header and footer for your document, click on the Insert tab at
the top of Word. Now locate the Header & Footer panel:

Click
on the Header item and you'll see a drop down list appear:

The
items on the list are Headers that are built in to Microsoft Word. There are
some nice Headers on the list, but we'll do our own so that you can see how
they work.
Select
the first item on the list, Blank. The top of your page will then look
like this:

Notice,
too, that a new tab has appeared - the Design tab. The panels on the tab
are: Header & Footer, Insert, Navigation, Options, Position, and Close.
The
thin, dashed blue line is the bottom of your header, and everything above is
the area where you can type your header text (or insert images).
There
is already a selected area with the words "Type text" in it. However,
this is the first page in the story. We don't want any header on the first
page, as it doesn't look very good. We want the headers to start on page two.
So
have a look at the Design tab, and locate the Options panel. Left click
inside the check box next to Different First Page:

Now
locate the Navigation panel, and click the Next Section button
(In Word 2010 and Word 2013, it's just Next):

The
header text on page 2 will now be selected. Go ahead and type the title of the
story again, Little Thumb.
Just
like text anywhere, you can select your header text and format it to your
liking. So choose a font and font size, and then centre it. (A quick way to
centre things is to hold the CTRL down on your keyboard. Keep it held down and
then press the letter "e"). For the font and the centring, you'll
need to click back on the Home ribbon. The Design ribbon will
stay open, though. (You might accidentally click outside of the header, and
lose the Design tab. To get it back, double click anywhere inside of the Header
area.)
Click
back on the Design tab when you're done. Your header will then look like this:

One
last thing we'll do here is to add a line in the Header, underneath the title.
To do
that, click on the Insert tab. From the Insert tab, locate the Illustrations
panel. On the Illustrations panel click the Shapes item, and then select
the straight line, as in the image below:

With
the line shape selected, click on your Design tab to get back to your Header
area. Now hold down your left mouse on the left edge of the header, just in
line with the left edge of the story. Keep your left mouse button held down and
drag to the right edge of the header. Release your mouse button when you get to
the right edge of the story. You will then have a line that looks like ours
below:

In
Word 2010 and Word 2013, if your line is not solid black, click on the Format
tab. Locate the Shape Styles panel, and click the first line:

Notice
the two round circles or squares at either end of your line. This indicates
that the line is selected. If your line is not big enough, or it's too big,
hold your left mouse button down on one of the circles. Your mouse pointer will
change to the shape of cross. Keep your left mouse button help down and drag
either to the left to make your line shorter, or to the right to make it
bigger. If your line is not straight, move your mouse up or down while holding
down the left mouse button.
To
move the whole line up or down, hold your left mouse button down anywhere on
the line except for the two green circles on the end. Keep your left mouse
button down and drag your line up or down. Place it just under the title.
Another
way to move the whole line is with the arrow keys on your keyboard, in
combination with the CTRL key. Hold down the CTRL key. Keep it held down and
tap one of your arrow keys. You can move the line up, down, left, and right
using this method.
When
you're done, though, your header should look like from above:
![]() Footers
Footers
Microsoft
Word allows you to insert page numbers into your document. This is done
(usually) in the Footer area of the page. The Footer is just the opposite of
the Header. You can do the same things with the Footer as you can with the Header.
We'll see how to insert page numbers into the Footer.
Make
sure the Design tab is select at the top of Word. Now locate the Navigation
panel again. Click the item that says "Go to Footer":

Word
will then jump to the bottom of the page, and your cursor will be flashing in
the Footer area. Because you checked "Different First Page", your
cursor should be on page 2 of your story.
To
insert page numbers, locate the Header & Footer panel on your Design
tab. Click the Page Number item to reveal a drop down list. From the
Page Number menu, select "Bottom of page", as in the image below:

When
you select "Bottom of page" you should see some options appear:

These
are built-in page number formatting. Scroll down and find one that you like.
Then click it with your left mouse button. We've gone with Square 2:

And
here's what our footer looks like on the page:

Once
you're happy with your headers and footers, you can close the Design tab. To do
that, click the Close button:

v MAIL MERGE - CREATING A DATA SOURCE
Mail merge is joining a Data source, such as an
address book, with a Microsoft Word document. When the two are joined, or
merged, you can print the results onto letters, or labels, or onto an envelope
directly.
We're going to create a Mail Merge for a
letter. Once we set up a database of people, we can insert fields into the
letter. With the click of a button all the letters will be created, along with
address information inserted. So open a new blank document and let's see how it
works.
Creating the
Data Source
1. The first
thing we need to do is to create a database of people, along with their address
information. We'll use this later with the mail merge.
2. To create
your database, click the Mailings tab at the top of Word. From the
Mailings tab, locate the Start Mail Merge panel:

3. Click on Select
Recipients to see a dropdown list:

4. We want to
type a new list, so click on that item. You'll see the following dialogue box
appear:

5. This
dialogue box allows you to type in address information, one address per line.
If you scroll across using the scroll bar at the bottom of the dialogue box
you'll see that there are a lot of columns you can fill in. You don't need to
fill them all in, you'll be glad to know, just the ones you need.
6. To see how
it works, type in a title, a first name, and a last name. You can use the same
(fictitious) information as us. In the image below, we've entered Ms Helen
James: (To get your cursor to flash in the next box, you can either just
left click, or you can press the TAB key on your keyboard.)

7. Now scroll
across and enter the address information (12 Old Square, Evercrease):

8. To add a new
address, click the New Entry button in the bottom left. A new row will
be created, and your cursor will be flashing in the Title box again. Add
the following addresses to your list:
Eric Khan, 10 New
Square, Evercrease
Tommy Lee, 26 New Square, Evercrease
Priyanka Collins, 14 Old Square, Evercrease
9. When you're
finished, your Address List should look something like this:

10.
Now click OK. When you click on OK, you'll see
the Save dialogue box appear:

11.
Take note of where the file is being saved, and
the file type. You are saving it in a folder called My Data Sources,
which is in the My Documents folder. The type of file is a MDB database.
12.
Type a name for you file in the File Name box.
We've called ours Address List. Click the Save button to save your address
list. You will then be returned to Microsoft Word.
13.
If you want to add new addresses to your list,
click on Edit Recipient List on the Start Mail Merge panel:

14.
When you click on Edit Recipient List you'll
see a dialogue box appear. This one:

15.
Click on your Data Source in the small
box just above the Edit button in the bottom left. Then click the Edit
button to bring up the Address List dialogue box again, where you can add a New
Entry to your list.
v
GOAL SEEK
Goal Seek is
used to get a particular result when you're not too sure of the starting
value.
Using Goal Seek
To
get a better understanding of what the goal seek command actually does, create
a spreadsheet that looks similar to this:
Step
1 – Set up a scenario

In
cell A1, we have the text “Already Know,” used as a label for the value within
our formula that we’re certain of. In this example, that value is 25, as seen
in cell B1.
In
cell A2, we have the text “Uncertain Value,” used as a label for the input
value we want to determine. In the current equation, we have a value of 75, as
seen in cell B2.
In
cell A3, we have the text “Desired Result,” used as a label for the expected
outcome of our equation.
Step
2 – Insert a formula

Next,
select cell B3 and enter =SUM(B1+B2) into the formula bar, and press
Enter. A value of 100 should appear in cell B3, the sum of cells B1 and B2. In
other words, 25+75=100.
Step
3 – Select the Goal Seek command

Next,
navigate up to the Data tab in the ribbon menu. At the far right, there should
be a group called Data Tools. Under the Data Validation and Consolidate
options, you’ll find a drop-down menu for What-If Analysis. Select that, and
from the menu, select Goal Seek.
Step
4 – Input the desired values

The
goal seek function requires input for three options.
Set
cell: Here, you need to input the name of
the cell where the formula is located. For our example, that’s cell B3, which
holds our formula =SUM(B1+B2).
To
value: Here, you need to input the real
desired value of our new equation, which the goal seek function will create.
We’ll set it to 200. This means we want the sum of cells B1 and B2 to equal
200. However, we can only do that…
By
changing cell: This one is very
straightforward. The sum of cells B1 and B2 can only equal 200 by changing the
value of one of our cells. In our example, we want to change cell B2, so we enter
in B2. Then, click OK!
Step
5 – Success!
Once
we hit OK, the computer finds that the only way to make the sum of cell B1 and
cell B2 equal 200, when B1 remains 25 and B2 is an unknown value, is to change
B2 to 175.
v
PIVOT TABLE
If you have a large spreadsheet with tons of
data, it’s a good idea to create a Pivot Table to easily analyze data more
easily. Today we take a look at creating a basic Pivot Table to better organize
large amounts of data to identify specific areas.
Excel Pivot Tables are tables that summaries
large amounts of data in an Excel spreadsheet.
Create a Pivot Table
First select any cell in the worksheet that
contains the data you want to create the report on. Then under the Insert tab
click on the PivotTable button.
For Example:
Name
Department
Salary

The PivotTable dialog box opens and the table
or data range we already selected will show in that field. You can have it
placed in a new worksheet or in the existing one where you will need to select
the location. For our demonstration we will put it in a new worksheet because
it makes things less cluttered.


The PivotTable Field List opens up and the
PivotTable tools become available.

Select the fields you want to include in the
table by dragging them to the different boxes below. The table is built while
dragging the fields into the boxes for Report Filter, Column Labels, Row
Labels, and Values. This lets you move the data around so you can best organize
it for your report.

You can arrange the view of the PivotTable Field
list so it works best for you.
While building the PivotTable it’s fully
functional so you can go through and test it out, like in this example where
we’re filtering the months.

So now instead of having to hunt through a
bunch of data in a large spreadsheet…
You can create a nice PivotTable for better
organization and presentations.
Hopefully this will get you started creating
your own Pivot Table. A lot of creating the table is trial and error and
finding the best way to organize the data. As you progress in your use of
Excel, you’ll find a lot of other customizations for more attractive layouts.
v MACRO
A macro is an
automated input sequence that imitates keystrokes or mouse actions. A macro
is typically used to replace a repetitive series of keyboard and mouse actions
and is common in spreadsheet and word processing applications like MS Excel
and MS Word.
Following are the steps for creating or
deleting macros in Excel 2007.
Record a macro
When you record a macro, the macro recorder
records all the steps required to complete the actions that you want your macro
to perform. Navigation on the Ribbon is not included in the recorded steps.
Note: The
Ribbon is a component of the Microsoft Office Fluent user interface.
1.
If the Developer tab is not available,
do the following to display it:
a) Click the Microsoft
Office Button ![]() , and then
click Excel Options.
, and then
click Excel Options.
b) In the Popular
category, under Top options for working with Excel, select the Show
Developer tab in the Ribbon check box, and then click OK.
2.
To set the security level temporarily to enable
all macros, do the following:
a)
On the Developer tab, in the Code
group, click Macro Security.
b)
Under Macro Settings, click Enable
all macros (not recommended, potentially dangerous code can run), and then
click OK.

3.
On the Developer tab, in the Code
group, click Record Macro.
4.
In the Macro name box, enter a name for
the macro.
1. To
assign a CTRL combination shortcut key to run the macro, in the Shortcut key
box, type any lowercase letter or uppercase letter that you want to use
2. In
the Store macro in list, select the workbook where you want to store the
macro.
3. In the Description
box, type a description of the macro.
4. Click OK
to start recording.
5. Perform the actions that you want to record.
6. On the Developer
tab, in the Code group, click Stop Recording ![]() .
.
Delete a macro
Do one of the following:
![]() Open the
workbook that contains the macro that you want to delete.
Open the
workbook that contains the macro that you want to delete.
![]() If the macro
that you want to delete is stored in the personal macro workbook
(Personal.xlsb), and this workbook is hidden, do the following to unhide the
workbook:
If the macro
that you want to delete is stored in the personal macro workbook
(Personal.xlsb), and this workbook is hidden, do the following to unhide the
workbook:
i.
On the View tab, in the Window
group, click Unhide.
ii.
Under Unhide workbooks, click PERSONAL,
and then click OK.
If the Developer tab is not available,
do the following to display it:
![]() Click the Microsoft
Office Button
Click the Microsoft
Office Button ![]() , and then
click Excel Options.
, and then
click Excel Options.
![]() In the Popular
category, under Top options for working with Excel, select the Show
Developer tab in the Ribbon check box, and then click OK.
In the Popular
category, under Top options for working with Excel, select the Show
Developer tab in the Ribbon check box, and then click OK.
On the Developer tab, in the Code
group, click Macros.
In the Macros in list, select the
workbook that contains the macro that you want to delete. Forexample, click This
Workbook.
In the Macro name box, click the name of
the macro that you want to delete.
Click Delete.
v Use of Excel sheet:
Microsoft
Excel is a spreadsheet program that is used to record and analyse numerical
data. Think of a spreadsheet as a collection of columns and rows that form a
table. Alphabetical letters are usually assigned to columns and numbers are
usually assigned to rows. The point where a column and a row meet is called a
cell. The address of a cell is given by the letter representing the column and
the number representing a row.
v Header, footer:
You can add
headers or footers at the top or bottom of a printed worksheet in Excel. For
example, you might create a footer that has page numbers, the date, and the
name of your file. You can create your own, or use many built-in headers and
footers.
Headers and
footers are displayed only in Page Layout view, Print Preview, and on printed
pages. You can also use the Page Setup dialog box if you want to insert headers
or footers for more than one worksheet at a time. For other sheet types, such
as chart sheets, or charts, you can insert headers and footers only by using
the Page Setup dialog box.
· Add or
change headers or footers in Page Layout view
· Click the
worksheet where you want to add or change headers or footers.
· On the
Insert tab, in the Text group, click Header & Footer.

· Header &
Footer option on the Insert tab
· Excel
displays the worksheet in Page Layout view.
· To add or
edit a header or footer, click the left, center, or right header or footer text
box at the top or the bottom of the worksheet page (under Header, or above
Footer).
· Type the new
header or footer text.
POWERPOINT
v What is PowerPoint?
PowerPoint
is a tool you can use to communicate your ideas effectively through visual aids
that look professionally designed yet are easy to make. With PowerPoint, you
can create slides for your presentation in the output you require: blank and
white overheads, color overheads, 35mm slides or on-screen electronic slide
shows. In addition, you can prepare speaker’s notes, print an outline and print
audience hand- outs. All these components in one file make up a PowerPoint
Presentation.
Starting PowerPoint
To launch
PowerPoint, Click the Start Button on the Windows Taskbar, select Programs and
then click on Microsoft PowerPoint. You might
also find the PowerPoint icon on your MS Office Toolbar. The PowerPoint
startup as shown below. To begin working with PowerPoint, you will need either
to open an existing presentation or create a new presentation using one of
available options.
They are
·
Blank Presentation
·
From Design
template
·
From Auto Content Wizard
·
From Existing Presentation Photo album.
Ø Creating a New presentation
Whether your
presentation will be in the form of an electronic slide show, 35mm slides,
overhead or just paper print-outs, the process of creating a PowerPoint
Presentation is basically the same. You can start with a template, a design
template or a blank presentation. To get to these three basics form, there are
three options.
Ø Blank Presentation
The blank
Presentation template is a design template that uses the default formatting and
design. It is useful if you want to decide on another design template after
working on the presentation content or if you want to create your own custom
formatting and design form scratch
•To create a
new presentation based on the presentation template, select Blank Presentation
from the PowerPoint startup dialog box and click OK. With PowerPoint already
running, you can (1) select New from the File menu, click the General tab on
the New Presentation dialog box, click the Blank Presentation icon and click OK
or (2) click the New button on the standard toolbar. The New Slide dialog box
appears.
Ø Working with slides:
· Add slides
· Select the
slide you want your new slide to follow.
· Select Home
> New Slide.
· Select a
layout.
· Select the
text box and type.
Ø Delete slides
For a single
slide: Right-click the slide in the thumbnail pane on the left, and select
Delete Slide.
For multiple
slides: Press and hold Ctrl, and in the thumbnail pane on the left, select the
slides. Release the Ctrl key. Then right-click the selection and choose Delete
Slide.
For a
sequence of slides: Press and hold Shift, and in the thumbnail pane on the
left, select the first and last slides in the sequence. Release the Shift key.
Then right-click the selection and choose Delete Slide.
Ø Duplicate a slide
In the
thumbnail pane on the left, right-click the slide thumbnail that you want to
duplicate, and then click Duplicate Slide. The duplicate is inserted
immediately after the original.
Ø Rearrange the order of slides
In the pane
on the left, click the thumbnail of the slide that you want to move, and then
drag it to the new location.
To select
multiple slides: Press and hold Ctrl, and in the pane on the left, click each
slide that you want to move. Release the Ctrl key, and then drag the selected
slides as a group to the new location.
Ø Types of slides:
PowerPoint
slides can be split into three different categories, which can exist in their
pure form or be combined with others:
1.
Text slides.
2.
Conceptual slides.
3.
Quantitative charts.
Ø Making presentation with slides:
Creating a
PowerPoint Slide
§ Step 1:
Open
Microsoft PowerPoint.
§ Step 2:
Go to File
at the top of the screen and click New. A box that says “New Presentation”
should appear on the right side of your screen.
§ Step 3:
In the “New
Presentation” dialog box, click on “From Design Template.” You may then scan
through design templates and choose one that you like.
§ Step 4:
Slide Design
Select a
design template by clicking on the template you like. You may choose a
different color for your template by clicking on “Color Schemes” in the “New
Presentation” dialog box.
§ Step 5:
Slide Layout
Change the
Slide Layout. You may change the slide layout (how information is presented in
the slide) by going to the top of the screen and clicking on “Format” – “Slide
Layout.” A box will appear on the right side of your screen (where “New Presentation”
appeared) labeled “Slide Layout.” You may select a design by clicking on it.
§ Step 6:
Adding Text
Enter your
text by clicking and then typing in the box titled “Click to Add Text” or
“Click to Add Title.”
§ Step 7:
Adding
Pictures
You may add
pictures by clicking on the box that says “Click to add content.” Inside that
box, there will be a smaller box with six icons. Click on the icon that looks
like a photograph of a mountain. A new window will open, allowing you to browse
for a picture on your computer or a CD. Once you find your picture, click on it
and then click “Insert.”
§ Step 8:
Resizing
Pictures
You may
change the size of your picture by clicking on the picture. The picture will
then have black lines around it with small bubbles or boxes in the corners.
Place your mouse over the bubbles or boxes and click. Holding the mouse pointer
down, drag the picture to the size you want.
§ Step 9:
You’re
Done! Wasn’t that easy? Now you can do it again to make more.
Ø Slide transition.

Transition effects—or
transitions as they are often called—are the movements you see when one slide
changes to another in Slide Show view. Transition effects are different from
animation effects. The term animation in PowerPoint refers to the movements of
text and objects on the slide, while transitions refer to the movement of the
slide as it changes to another slide.
To apply a
transition to one slide:
1.
Select the slide you want to modify.
2.
Select the Animations tab.
3.
Locate the Transition to This Slide group. By
default, No Transition is applied to each slide.
4.
Click the More drop-down arrow to display all
available transition effects.
5.
Click a slide transition effect to apply it to
the selected slide.

To apply a
slide transition to all slides:
1.
Select the slide you want to modify.
2.
Select the Animations tab.
3.
Locate the Transition to This Slide group. By
default, No Transition is applied to each slide.
4.
Click the More drop-down arrow to display all
transition effects.
5.
Click a slide transition effect to apply it to
the selected slide.
6.
Click Apply To All to apply the transition to
all slides in the presentation.
MS EXCEL
A
spreadsheet is essentially a matrix of rows and columns. Consider a sheet of
paper on which horizontal and vertical lines are drawn to yield a rectangular
grid. The grid namely a cell, is the result of the intersection of a row with a
column. Such a structure is called a Spreadsheet.
A
spreadsheet package contains electronic equivalent of a pen, an eraser and
large sheet of paper with vertical and horizontal lines to give rows and
columns. The cursor position uniquely shown in dark mode indicates where the
pen is currently pointing. We can enter text or numbers at any position on the
worksheet. We can enter a formula in a cell where we want to perform a
calculation and results are to be displayed. A powerful recalculation facility
jumps into action each time we update the cell contents with new data.
MS-Excel
is the most powerful spreadsheet package brought by Microsoft. The three main
components of this package are
v Electronic spreadsheet
v Database
management
v Generation
of Charts.
Each
workbook provides 3 worksheets with facility to increase the number of sheets.
Each sheet provides 256 columns and 65536 rows to work with. Though the
spreadsheet packages were originally designed for accountants, they have become
popular with almost everyone working with figures. Sales executives, book-keepers,
officers, students, research scholars, investors bankers etc, almost any one
find some form of application for it.
You will
learn the following features at the end of this section.
v Starting
Excel 2003
v Using Help
v Workbook Management
v Cursor Management
v Manipulating Data
v Using
Formulae and Functions
v Formatting
Spreadsheet
v Printing and Layout
v Creating
Charts and Graphs
Starting Excel 2003
v Switch on
your computer and click on the Start button at the bottom left of the screen.
v
Move the mouse pointer to Programs, then across to
Microsoft Excel, then click
on Excel as shown in this screen.
v When you
open Excel a screen similar to this will appear

v The options
shown below is called as Menu Bar
v The
collection of icons for common operations shown below is called as Standard
Tool Bar
![]()

v
The formula bar is the place in which you enter the formula(=A3*B5)
v The alphabets A,B… are known as columns
![]()
v
This is the name of the workbook. (Book1)
v The rows are
numbered as 1,2,3…
v Sheet1,Sheet2, Sheet3 are known as worksheet tabs
How to use Help Menu
v Click on Help,
Contents and Index,
then click on the Index
tab. The following screen will appear
v Type the
first few letters to see the help entries for those letters.
v You can get
the printout of any help topic by selecting it, right clicking and then
clicking Print Topic.
Workbook Management
Task 1: Creating a new workbook
v Click on File menu and then click on
New.
v Click
Workbook and then click OK button. You will get
the screen as shown below.

v Enter data
as shown in the figure below :
Task 2: Saving Workbook
v Click on File menu and then click save. You
will get the below screen
v In the File name text box, type sample and then click Save
button
Task 3: Opening an existing workbook
v Click on the
File menu and click on Open. The open dialog box will appear

v Click on
some file (Example: sample.xls), then click on
Open.
Task 4: Closing your workbook
v Click on
File menu, then click Close to close your workbook
Cursor Management
Task 1: Moving around the worksheet
v Open sample.xls workbook.
v Move the
cursor in your worksheet by using the arrow keys on the right-hand side of the keyboard.
v When you
have got lots of rows of data you can move the cursor more quickly by using the
PgUp and PgDn keys to move up and down a screen at a time.
v To move one screen to the right, press the Alt key and PgDn
keys together.
v To move one
screen to the left, press the Alt and PgUp keys together.
v To move
further to the right, just keep
pressing the right arrow
key
v To move back
to cell A1, press the Ctrl and Home keys
together.
v Pressing the
Home key on its own takes you back to column A
v To move to the last column(IV) press the Ctrl and right arrow
keys
together.
v To move to
last cell containing data, press Ctrl and End keys together.
v To move to
the last row(65,536), press Ctrl
and the
down arrow keys together.
v You can also
move the cursor with the mouse. Move the mouse pointer to the location you
want. Press and release the left mouse button once when the cursor is where you
want it.
Task 2: Moving to a Specified cell
v Click on the
Edit menu, choose Go To. You will get the below screen
v Enter the
destination cell reference in the Reference text box.
v Click OK to
move directly to the specified cell.
Data Manipulation Task 1: Entering data
v Start Excel.
Click File and then New. An empty worksheet appears as shown below

v Type
Expenditure in cell A1 then press down arrow key to move to cell A2.
v Type Month
then press the down arrow key to move to cell
A3
v Continue to
type the data. The resulting worksheet should appear like the following screen.

v Save your work by clicking File and then Save
As. This dialog box appears.
v Type cash in
the File Name text box and then click
Save button. Excel automatically adds the extension .xls to your file name.
Task 2: Editing data
v Click File and then click Open.
v Click cash.xls and then click Open.
v Move the
mouse pointer to cell D4, click and release. The cell is highlighted and 18
appears in the formula bar.
v Move the
mouse pointer to the formula bar and click once to the right of 18.
v Use the
Backspace key to delete 8,then type 4 and press
Enter. Cell
D4 now contains the value 14.
Task 3: Replacing cell data
v Make the
cell B5 active by clicking on it.
v Type 200 and
press Enter. The cell B5 will now contain the value 200 replacing old value (150).
Task 4: Deleting cell contents
v Move to cell
C5 and click to select.
v Press the Delete key.
v The cell
becomes blank.
v Drop down
the Edit menu and click Undo to reinstate the 145. Excel 97 allows 16 levels of
undo. You can use Undo and Redo buttons also.
Task 5: Copying data
v Open the
cash spreadsheet.
v Select the
cells D3 to D5
v Click Edit
menu and then click Copy.
v Select the
cells F3 to F5.
v Click Edit menu and then click Paste.
v Now the
cells D3 to D5 are copied into F3 to F5.
Task 6: Moving data
v Open
cash.xls spreadsheet.
v Select the
cells from B3 to B5.
v Click Edit menu and then click Cut.
v Select the
cells G3 to G5.
v Click Edit menu and then click Paste.
Task 7: Data Auto Fill
There is an
easy method to fill the data in columns and rows. The data may be Numeric or dates and text.
To
fill Slno by using auto fill
¨ Type Slno
for 2 cells i.e 1,2 in the cells A1 and A2 respectively.
¨ Select two cells and drag the Fill Handle
To fill
dates in the cells
¨ Type date in
the cell
¨ Select the
cell and drag the Fill Handle
We can
customize the lists with different text data to minimize the redundancy of
work.
Some of the
lists are listed below:
1. Jan, Feb,
Mar, Apr, May, June, July…. like months
2. Sunday,
Monday, Tuesday, Wednesday, Thursday…Like week days
3. Adilabad,
Anatapur, Chittor, Cuddapah… like District names
4.
Ravi, Kiran, Praveen, Rama….
like employees list To create a
customized list follow the steps given below:
¨ Click
Tools Menu ,Click Options then click Custom Lists tab, Then you will find the
figure given below:

¨ Click NEW LIST and enter the list in the List entries window
¨ Click Add
button then click OK button then your list will be added to the Custom Lists. That list you can
use as and when required to type.
¨ Now you can
Drag the fill handle (+ ) to get the
list automatically.
Using
Formulae and Functions Task 1: Entering a formulae
v Click File and then click New.
v Enter the
data in the new worksheet as shown below

v Cell B6
should contain formula. Move the cell pointer to cell B6.
v Type =B3+B5(formulae and functions should always begin with
=
sign)
v Cell B6 will
now contain the value 350
v Look at cell
B6; you will see the result of the formula in the cell B6 rather than formula.
v Now repeat
the appropriate formula for cell C6, D6.
v Save your
worksheet as cash3.xls.
Task 2: Editing Formulae
v Move the
cursor to the formula bar with the mouse, clicking once.
v Make the
desired changes.
v When you
have finished editing the formulae, press the Enter key for the changes to take effect.
(OR)
v Edit the
contents by pressing F2 key on the keyboard
Task 3: Displaying and Printing formulae
v Click Tools menu and then click Options.
v Click View tab.
v In Window options check Formulas check box. The below screen appears.

v Click OK button.
v To print the
worksheet with formulae displayed, click File menu and click on Print Preview.
If the layout is satisfactory, click on the Print button.
Task 4: Using the SUM function
v Open cash3.xls spreadsheet.
v Suppose if
you want the summation of the cells B3 to B5 should appear in the cell B6, then
first select the cells from B3 to B6.
v Click the Auto Sum ![]() icon
on the toolbar.
icon
on the toolbar.
v The result
of (B3+B4+B5) will appear in the cell B6.
Task 4: Copying Formulae
v Open cash3.xls spreadsheet.
v If you want
to copy the formula in the cell B6 to C6,D6,E6 then first select the cell B6.
v Move the
cursor to the lower right corner of the cell B6. The cursor will change to + icon.
v Drag the
cursor from B6 to E6 and release left mouse button.
v You will
notice that the cells C6, D6 and E6 are updated immediately as shown below.
Task 5: Copying formulae using absolute addressing
v Create the worksheet
shown below and save ABS
v If you copy
the formula in the cell c2 to c3, c4, c5 you will get the incorrect

v result
because the formula will change in the cell (C3)to B3*A10 but the value in the
A10 is not defined. The reason is that we are copying relative address but not
absolute address. To use absolute address move to c2 cell.
v Edit the formula to =B2+($B$2*$A$9) and press Enter key.
v Copy the
formula to cells C3 to C5.
Formatting Spreadsheet
Task1: Increasing column width
v Open an
existing worksheet(For example cash3.xls)

v Move the
mouse pointer to the position(column B)shown below in the column header. When
the black cross appears, hold down the left button and drag the mouse to the
right to increase the column width by the required amount.
Task 2: Decreasing column width
v Open cash3.xls spreadsheet.
v Move the
mouse pointer to the column B. When the black cross appears, hold down the left
button and drag the mouse to the left to reduce the cell width.
Task 3: Changing width of all cells in a spreadsheet
v Open cash3.xls spreadsheet
v Select the
entire worksheet by clicking the Select All button (to the left of A1 cell) at
the top left corner of the worksheet. The worksheet changes from white to black.
v Click Format menu, click Column, then click Width
v In the
column width text box type 20, then click OK button. Your worksheet cells
should all increase in width.
v You will get
the below screen. You will notice that widths of all columns are now changes to
20

.
v Click the
Undo button to revert to the previous cell width.
Task 3: Inserting Columns
v Open
cash.xls spreadsheet.
v Move to cell
B2 and click.
v Click Insert
menu, click Columns. You will get
the below screen.
v A blank
column will be inserted before(to the left of column B)
Task 4: Deleting Column contents
v Open
cash.xls spreadsheet.
v Move the
mouse pointer to column E header and click to select column E
v Press Delete
button. The column contents will be deleted.
v Click Undo
button to revert to the previous screen.
Task 5: Removing columns, rows, and cells completely
v Select
individual columns or rows or cells.
v Click Edit menu
and click Delete Task 6: Inserting a row
v When
you insert a row, it is inserted above the current row, so if you want to insert
a new row above row 6(between rows 5 and
6), place the cursor on a cell in row 6 and
v Click on the Insert menu.
v Click Entire
Rows insert a blank row between rows 5 and 6.
Task 7: Deleting row contents
v Open
cash.xls spreadsheet.
v Move the
mouse pointer to row 2 header and click to select the row as shown below

v Press Delete
to remove the contents of row.
v Click the Undo
button to cancel the delete operation.
Task 7: Inserting cells
v Open
cash.xls spreadsheet.
v Select cells
B2 to D4 by moving the mouse pointer to cell B2, holding down the left mouse
button and dragging the mouse pointer to cell D4, then releasing the left
button. The cells should be highlighted.
v Click Insert
menu and click Cells. This dialog box appears.
v Click OK to
shift the cell down.

Task 8: Changing data justification
Open cash.xls spreadsheet.
Select the cell B2 as shown below.
Here the text “Jan” by default left justified. You can
modify alignment as right justified or center by clicking right justify ![]() or center
the text
or center
the text ![]()
within the cell by clicking respectively.
Task 9: Merge and Center data
Open cash.xls spreadsheet.
Select the cells A1 to H1 as shown below
Click Merge and Center button on the toolbar
![]()
You will
get the below screen.
Task 10: Formatting cells
Create a new spreadsheet as shown below and save it as “marks.xls”
Now you can format the cells in column C by selecting column C by clicking on
the column heading
Click Format menu and
click on Cells. Click on Number.
Use the Down arrow in the
Decimal Places to set to 0. Click
OK.
Now repeat the formatting but this time format the cells to two decimal places.
Again, repeating the formatting operation, but this time to four decimal
places.
Finally, format the cells to eight decimal places. This screen will appear.
The #### symbols indicate that the cell is too narrow to display the data in
the chosen format. However, if you increase the cell width sufficiently, the
data will be displayed to eight decimal places.
Increase the width column C until the data is
displayed.
Now change the formatting back to two decimal places, and reduce the column
width to a suitable width.
Changing the data Orientation (Vertical, Horizontal etc.)
Excel offers three options that let you control the orientation of the text
within a cell. These are Text alignment,
Text orientation, and Text control.
Vertical
text alignment can be any one of the following
![]()
To display
text vertically in a cell:
Choose Cells from the
Format menu.
Click the Alignment Tab.
Specify the desired text orientation by selecting one of the orientation boxes.
Select the Wrap text check box, if you
want Excel to wrap the text
Click OK
Here are
some examples of the different alignment options

Select vertical list box and select top to align the data at the top of the
cell (Eg: cell A1)
The below figure shows you different Text control options.
Printing and layout
Task 1: Previewing a printout
Open cash.xls spreadsheet.
Click on the File menu and click on Print Preview. A screen similar to this should appear.
Since the size of the text is very small, you can click on Zoom button, it
magnifies the worksheet. Clicking on Zoom second time returns you to the
original preview format.
Press PgDn to move through your worksheet if it is more than one page long.
Before printing make sure that your printer is switched on, is loaded with the
appropriate paper, and is on-line.
If you are happy with the layout of your document, click on the
![]()
Print button
to obtain a printout. You should see a message on screen telling you that your
file is being printer, and on which paper.
Task 2: Printing landscape
To select landscape mode,
click on the File menu, Page Setup
this screen will appear.
Click on
the Landscape button.
Task 3: Fitting your worksheet to one page
In the above screen click on the Fit To: box and type: 1 page wide by 1 page tall.
If you need to make changes to your worksheet before printing, click on the
Close button to return to your workbook.
Task 4: Adjusting margins
In the Page Setup dialog box, click the
Margins tab and enter the appropriate
sizes(in inches or centimeters)
Task 5: Setting Header/Footer
to your worksheet
v From the Page Setup dialog box, click on the Header/Footer
tab to display the below screen.
v
In the Header box either you select a title
from the drop down menu or enter your own title. Similarly for Footer box also
you can set your own title.
v
Click on OK.
Task 6: Printing
selected cells
v
Open cash.xls
spreadsheet.
v
Click on the row 2 button (or any other row
containing data) to highlight the entire row.
v
Click on File, Print Area, Set
Print Area. The preview screen should only display
the selected cells.
(Row 2).
v
If the preview is satisfactory, click the Print
button to print out only row 2.
v
Click on File, Print Area,
Clear Print Area to reset the Print Area.
Creating charts and graphs Task 1: Creating a Pie Chart
v
Open cash.xls
spreadsheet.
v
Select the cells A1 to G5 as shown below
v
Click on
Insert menu and click Chart option. This will start the Office Assistant, to
guide you through creating chart.
v
Follow the instructions in each step of the
Wizard. The Assistant explains each step.
v
At step 3, you can specify
the Chart title, X-axis title and Y- axis title separately.
v
At step 4, click As object
in sheet 1, then click Finish.
v
Your chart is now finished. Save as cash4. Your
chart is saved with the spreadsheet. This type of chart is known as an embedded chart and is saved with its worksheet.
Task 2: Creating charts when the data range is not continuous
v
Open cash4.xls
v
If your requirement is create a chart to show
expenditure for February, then first select cells A2 to A5.
v
Hold down the Ctrl key and, while holding it
down, select cells C2 to C5. Your screen
should be similar to this one.
v
Click on the Chart Wizard and create a column
chart. Your screen should look similar to this.
v
If your chart doesn’t appear to show any data,
you probably included some other cells, probably A1 and/or C1. If so, delete
your chart and re-select the correct range.
Task 3: Sizing a chart
¨ Open the
cash3.xls created earlier. A screen similar to this one should appear.
v The small black markers at each corner and
mid-way along each side of the chart. These indicate that the chart is
selected, and are called its selection squares.
v Click on the
mid-point marker on the right-hand side, hold down the left mouse button and
drag the mouse to the right about one inch(3cm), then release the mouse. The
width of the chart will have increased.
v Now practice
the same operation on the mid-point marker of each of the other sides of the chart.
v Now try the
above, but this time on one of the four corner markers. Note that when you use
these techniques, the whole chart changes in size, but it retains its original proportions.
v Now use the
same technique to reduce the size of the chart.
Task 4: Deleting Charts
v Make sure
the chart is selected(the small black markers are visible). If not, move the
mouse pointer into the chart area and click and release the left mouse button once.
v Press Delete
to delete the chart.
Task 5: Moving charts and graphs
v Make the
chart active.
v Move the
mouse pointer into the chart area.
v Hold down
the left mouse button and drag the chart to the desired position.
Task 6: Chart headings and labels
v While creating charts the step3 asks for Chart heading, labels for X-axis
and Y-axis. You can define your own
labels or click Next button so that the default values can be accepted.

v For example Chart title is Expenditure,
X-axis label is
months and
Y-axis
label is Sales
Task 7: Editing chart items
v Create the
chart as shown below and save it as cash4.xls.
v
Click the chart title(Expenditure). Selection
markers(small black squares) will appear around the selected item.
v
You can move or size the title in the same way
that you can move or size a chart. Click the title box and drag it up by about
one inch (3 cm), then release the mouse.
v
You can format the title by selecting it, then
right clicking and then selecting “Format Chart Title” from the drop down menu.
You will get the below screen.

v
You can
select font type, font style and font size as shown above
v
Click OK.
Task 8: Adding text to a chart
v
Open cash3.xls worksheet.
v
Click View menu, click
Toolbars, Drawing.
v
Click the Text box icon on the Drawing toolbar.
v
Draw a text box inside the chart area as shown below

v
Click inside the text box. A flashing text
cursor will appear. Now type Household Expenditure
v
You can use the same procedure for any other
text that you want to appear in charts.
Task 9: Adding a legend to a chart
v
Create a pie chart as shown below.
v
Display the Chart
toolbar, by dropping down the view menu and clicking Toolbars, Chart. In
the above figure the legend is already added.
v
Click inside the pie chart, then click once on
the add or delete legend button on the Chart toolbar. The legend will be added
if not already present and removed if it is currently present.
v
You can also add or delete a legend from the
Chart, Chart options menu
Task 10: Adding gridlines to a chart
v
Open cash3.xls worksheet and change chart type
to Column chart.
v
Click Chart, Chart options
to display this box.
v
Click the Gridlines tab and tick the gridlines boxes required.

Task 11: Adding data labels
to a chart
v
Open cash3 worksheet and change chart
type to pie chart.
v
Drop-down the chart menu
and click Chart options.
v
Click on the Data Labels tab.
v
Click on Show label and
percent. Your screen should look similar to
this.

PowerPoint
In this
chapter you will be knowing about :
·
What
is power Point
·
·
Starting PowerPoint
·
Creating a new
Presentation
·
Creating Slides
·
Adding text to
slides
·
Working in different Views
·
Changing the Slide Layout
·
Making the Presentation you need
·
Delivering an On-screen Show
·
Saving your Presentation
·
Printing
·
Getting Help
What is PowerPoint ?
PowerPoint
is a tool you can use to communicate your ideas effectively through visual aids
that look professionally designed yet are easy to make. With PowerPoint, you
can create slides for your presentation in the output you require: blank and
white overheads, color overheads, 35mm slides or on-screen electronic slide
shows. In addition, you can prepare speaker’s notes, print an outline and print
audience hand- outs. All these components in one file make up a PowerPoint
Presentation.
Starting PowerPoint
To launch
PowerPoint, Click the Start Button on the Windows Taskbar, select Programs and
then click on Microsoft PowerPoint. You might
also find the PowerPoint icon on your MS Office Toolbar. The PowerPoint
startup as shown below. To begin working with PowerPoint, you will need either
to open an existing presentation or create a new presentation using one of
available options.
They are
· Blank Presentation
· From Design template
· From Auto
Content Wizard
· From
Existing Presentation Photo album.

Creating a New presentation
Whether your
presentation will be in the form of an electronic slide show, 35mm slides,
overhead or just paper print-outs, the process of creating a PowerPoint
Presentation is basically the same. You can start with a template, a design
template or a blank presentation. To get to these three basics form, there are
three options.
Blank Presentation
The blank
Presentation template is a design template that uses the default formatting and
design. It is useful if you want to decide on another design template after
working on the presentation content or if you want to create your own custom
formatting and design form scratch.
To create a new presentation based on the presentation template, select
Blank Presentation from the PowerPoint startup dialog box and click OK. With
PowerPoint already running, you can (1) select New from the File menu, click
the General tab on the New Presentation dialog box, click the Blank
Presentation icon and click OK or (2) click the New button on the standard
toolbar. The New Slide dialog box appears.
Auto content Wizard
The Auto
content wizard is a series of dialog boxes that gets you started with creating
a new presentation using a template. You’ll start by answering questions about
your presentation and end up with the readymade slides. To activate this
on-line guide from the PowerPoint is already running, select New from the File
menu. On the New presentation dialog box, click the presentation tab , click
the icon for
Auto content
Wizard and click OK. To bypass the Wizard, click instead the icon for the
template you want and you’ll get the slides directly.
Design Template
This is
advised for first-time and new PowerPoint users. After a few presentations on
your own, you more than likely will always choose this option so as to have
complete control over your presentation. A design template is a presentation
that does not contain any slides but includes formatting and design. It is
useful for giving your presentations a professional and consistent appearance.
You can start to make a presentation by selecting a design template or you can
apply a design template to an existing presentation without changing its contents.

Once you
have chosen the ‘template’ option, you have 5 more options in New Presentation
dialog box.
General :
Gives one the option to begin with a blank template
Presentation
Designs: Gives PowerPoint templates from which to work,
Presentations:
A Presentation template is a
presentation that contains slides
with a suggested outline, as well as formatting and design. It is useful if you
need assistance with content and organization for certain categories of
presentations such as : Training: Selling a product, Service, or an idea:
Communicating Bad News. When you make a new presentation using a template,
you’ll get a set of ready-made slides. You replace what’s on the slides with
your ideas, and insert additional slides as necessary.
Web pages: Allows one
to add web presentations and documents from your local or network computers,
Office 2003
Templates: Contains your favorite PowerPoint templates from Office 95, 97 and
2000.
It is hoped
that by the end of our class ( or the end of this document), you will feel most
comfortable choosing the second option, “Presentation Designs” and getting down
to business.
Creating Slides
When you
create a new presentation using a template (including the Blank Presentation
template), you start with first and then continue to build the presentation by
inserting new slides.
Inserting New Slides
To add a new slide after the current slide in Slide View:
·
Choose New Slide From the Insert menu, or
·
Click the Insert New Slide button on the
Standard toolbar
This bring up the New Slide dialog box.
On the New
Slide dialog box PowerPoint gives you a set of available slide layouts, called
Auto layouts, to choose from. An Auto Layout contains placeholders for titles, Text and objects such as clip art , graphs
or tables that you may want to put on a slide. You are not limited only by this
option. As you will see later in the handout, anything can be added to any
slide. To create slide, click an Auto layout icon that matches the layout of
the slide you want to make; the name of the selected Auto layout appears in the
lower right side on the dialog box. Then click OK and the new slide appears on
the screen.
Adding Text to Slides
You can
insert text on slides by selecting an Auto Layout with text placeholders. Text
placeholders are formatted for titles and bulleted lists. The text formatting,
which includes the font, alignment and bullets, depends on the design template
you selected.
Using Text Placeholders
To add text
to a slide in Slide in Slide View, simply click on the text placeholders. The
directions on the placeholder will disappears will disappear, leaving an empty
text box with a flashing insertion point. Begin typing. Text automatically
wraps as you reach the right border of the placeholder. When you’re done, click
anywhere else on the slide. To edit text, move the mouse pointer over the
text(note that it becomes an l-beam), click and edit.
When making
a bulleted list, you automatically create the next bulleted item every time you
press Enter. To create sublevels, click the Demote(indent more) button on the
Formatting toolbar. To move up a level, click Promote(Indent less). You
bulleted list can have up to five
levels.
Using the Text Tool
You can use
the Text Tool on the Drawing toolbar to add text outside of the text
placeholders. In Slide View, click the Text Tool and move the mouse pointer to
the point on the slide where you want to insert text. Click to make a
label/Caption or drag to make a text box that will wrap the words. Then begin
typing and, when you’re done, click anywhere else on the Slide.
Adding slide Objects
You can
incorporate elements, such as graphics and even sound and video, into your
slides in one of to ways.
·
Select an Auto Layout containing a placeholder for
an object. Some placeholders are for specific object such as clip art, graphs,
tables, organizational charts or media clips while other placeholders are for
all type of objects.
·
Select the
desired object (Clip Art, Picture, Move, Sound, Microsoft Graph,
Microsoft Word Table,
Object) from the
insert menu. Click on Object….
From insert menu brings up the
Insert object dialog box which lists all
the different types of objects that can be embedded in PowerPoint Slides.
You create embedded
objects using another application while you are working in PowerPoint. (This
requires that you have the application installed on your machine.)
The object’s
application menu and toolbar appear on the screen and may temporarily replace
the PowerPoint menu and toolbars. When you’re finished, click anywhere else on
the slide to return to PowerPoint.
To edit
embedded objects you created, double-click on the object. Again the object’s
application menu and toolbar appear. Make the changes and , when you’re done,
click anywhere also on the slide.
Tables
To inset a Microsoft
Word table on a slide:
·
Double-click on a Table Placeholder,
·
Click on the Word Table Button shown here, or
·
Under the Insert menu, choose Picture, then
Word table
And specify
the number of rows and columns you want. If you click on the Insert Microsoft
word Table button on the
standard toolbar, drag on the cells to select the number of
rows and columns.
The table
appears along with Word’s application menu and toolbars. Type the table
contents and, when you’re finished, click anywhere else on the slide. To edit
the table, double-click on it and edit the table using Word tools and menus.
Clip
Art
You can put graphic images from
Microsoft ClipArt Gallery on your slides. To add Clip Art to a slide:
·
Double-click on Clip Art placeholder.
·
Under the Insert menu, choose Picture, then
clip art. Click the Insert Clip Art button on the Standard toolbar.

Picture
Word
Art Object:
You can put
scanned image or art created from other programs on your PowerPoint slide.
Select Picture from the Insert menu,
choose from Scanner and use the MS office photo editor after opening the file
from your computer


You can add
text with special effects in your slides using Microsoft WordArt. There are at
least three ways to put word art in your PowerPoint choose object from the
insert menu, or double-click on an object placeholder. In the Insert Object
dialog box, select
Create New and chose the latest version of Microsoft Word Art from the
Object Type list. The WordArt dialog box
and menus appear. Type the text and click on Update Display.
Choose the special effects you want from the WordArt toolbar. When you’re done,
click anywhere else on the slide.
Working in
Different Views
You can
switch between five views of your presentation; each view gives you a different
way of looking at and working with your presentation. To toggle between views,
choose the desired view format from the
View menu or click the appropriate button to the left of the horizontal
scrollbar (shown here to the left). From left to right, the view are Slide
View, Outline View, Slide Sorter
View, Notes Pages View and Slide Show View.
Slide View
In Slide View, you can
add graphics to your slides as well as type, edit and format text, PowerPoint
displays the Formatting and Drawing toolbars in addition to the standard
toolbar. The presentation appears
on the screen one slide
at a time. The left side of the status bar displays the page number of the
current slide. To move to other
slides, drag the
elevator on the vertical scroll bar or click the Previous slide or nest slide
button below the scrollbar.
Outline
View
Working in
Outline View is a good way to organize and develop the content of you
presentation. To insert text, click where you want to add text and type. Bullet
and their editing is very easy in this view. Creating sub-level along with
promotion and demotion text can be done here as well. You can also print a copy
of you outline. In this view, you see only the title and body text of each
slide. The drawing toolbar closes and the Outlining toolbar opens. This works
much like the Microsoft World Outlining toolbar.

Slide Sorter View
In Slide
Sorter View, you can efficiently perform tasks such as reordering slides and
adding builds, transitions, and slide timings for electronic presentations. You
cannot work on text and visual elements of individual slides in this view.
PowerPoint displays miniature versions of each slide. In addition to the
standard toolbar, PowerPoint
displays the Slide Sorter toolbar.

Notes page
View
In Notes
Pages Views, you can create pages that you can print and use as a guide during
your presentation. Each page contains an image of the corresponding slide and
placeholder for your notes.
Power Point  Page
14 of 22
Page
14 of 22
Slide Show View
You use
Slide Show view to deliver you presentation as an on-screen electronic slide
show or to look at each slide full-screen. Click the mouse button to advance to
the next slide. If you’ve reached the last slide or press the Esc Key on the
keyboard, you return to the previous view.
Changing the
Slide Layout
In Slide
View, you can change the arrangement of objects on a slide, move and resize
placeholders or replace the current layout with a different Auto-Layout.
Moving and
Resizing objects
To move or
resize an object, first click on the object to select it. Eight handles appear
around the object. Click and drag a handle to change the size and / or shape of
the object. Click and drag anywhere else on the object to move it.
To resize an
object by an exact scale while maintaining its proportions, select the object
and then choose Scale from the Draw menu. Enter the scale on the Scale dialog
box and click on OK.
Moving and Resizing Placeholders
To move or
resize or placeholder, select the placeholder and click on its dashed border.
You will get a fuzzy outline around the border with eight resize handles. Click
and drag a resize handle to change the size and / or shape of the placeholder.
Click and drag anywhere else on the
fuzzy outline to move it.
Changing the Auto Layout
To restore a
slide’s layout after you’ve made changes to it or to change the Auto Layout without deleting any
text or object you’ve already put on it select Slide Layout from the Format
menu or click Slide Layout button on the Status bar. Select the Auto Layout
from the Slide Layout dialog box and
click Reapply.
Making
the Presentation You Need
Slide Setup
Unless you
created the presentation using the Auto Content Wizard and specified otherwise,
slides are by default up for an on-screen show. To change this, select Page
Setup from the File menu. On the Slide Setup dialog box, select the output you
want from the Slide Sized for drop down
list. You can also change slide orientation from landscape to portrait, and the
physical size of your printouts.
Arranging the Template
To change
the prostration’s design template, select
Apply Design from the Format menu
or click the Apply Design Template button on the Standard Toolbar. In the Apply
Design Template dialog box, select the design template and click Apply. On a
typical installation of PowerPoint, the design templates are in the
presentation Designs folder in C:\MSOffice\Templates. You can also use your own
design templates or even an existing PowerPoint Presentation.
Black & White Slides
To display
the presentation in black and white,
select Black and White from the View menu or click the
B&W View button on the Standard Toolbar. In Slide view, you’ll see the
current slide in black and white and a color slide miniature on a small Color
View window. The B&W View button toggles between the black and white and
color views. To hide the Color View
window, select Slide Miniature from the
View menu.
Deleting a Slide
To delete a
slide in Slide View, select Delete Slide from the Edit
menu. In Slider Sorter View, Select a slide and hit the delete key from
your keyboard.
Reordering Slides
To move a
slide, select the slide in Slide Sorter View and click the Cut button on the
Standard toolbar. This copies the slide to the Clipboard. Then click on the
position where you want to insert the slide (note the flashing insertion point)
and click the Paste button. You can also change the order of your slides in
Slide Sorter View by clicking on a slide and dragging it to the position where
you want it to appear.
Delivering an On-Screen Show
To deliver
your presentation as an on-screen electronic slide show, open the presentation
in PowerPoint; select Slide Show from
the View menu. By choosing Setup
Show from the Slide Show menu you can choose which slides you want to show
during the presentation.
During the Presentation
To move to
the next slide, click the mouse button or press ‘N’ on the keyboard. To get a
menu of available slide show commands, click the right mouse button or this
icon that appears on the lower left side of the screen.
·
To go directly to a
particular slide, select Go To, Slide Navigator from the menu. On the Slide
Navigator dialog box, select the slide and click Go To.
·
To annotate a slide during a show, select Pen
from the menu and the mouse pointer
toggles to a pen. Click and drag to write or draw on the slide. To return to
advancing the slides, switch back to the arrow by selecting Arrow from the menu
You can
deliver an on-screen show on a computer that doesn’t have PowerPoint installed
using the PowerPoint Viewer,
freeware that you can distribute with your presentation.
You can create disks that contain the presentation and PowerPoint
Viewer. Select Pack
and Go from the File menu and the Pack and Go Wizard guides you through the process.
Slide Timings
When delivering an electronic slide
show, you have the option of manually advancing the slides or using slide
timing. In Slide Sorter View, click the Rehearse Timing button on the slide
sorter toolbar and rehearse the delivery
of your presentation. The rehearsal window
that stays on the
screen during the slide show keeps track of the time elapsed since a slide
appeared on screen. At end of the slide show PowerPoint gives you the total
time of the presentation and the option
to record the slide timings. If you record the slide timings, they will appear
in Slide Sorter View. To manually revise the timing set for a particular slide,
select it in slide sorter View and click and Slide Transition Button on the
Slide Sorter toolbar. Then enter a
number in the Advance Automatically
after box. To use the slide timings
during a slide show, choose Use Slide
Timings on the Slide show dialog box.
Transitions
are special audiovisual effect that occurs when moving from slide to slide
during a electronic presentation. To add a transition to a selected slide in
the Slide Sorter View, click the Slide Transition button on the slide Sorter
toolbar. From the Transition dialog box, you can choose the effect and speed of
the transition and a sound to accompany the visual effect. A transition icon
appears below the slide miniature of a slide with transition. You can preview
the transition on the miniature by clicking on the icon. If you want the same transition
on all your slides,
choose Select all from the Edit menu and then all the transition.
Builds
You create
build slide if you want to show paragraphs on a bulleted list one at a time during a slide show. To
build the body text of a selected slide, choose an option that appears when you
select Present Animation from the Slide Show menu. If you select an option
other than off, during a slide show the list will appear by first level
paragraphs with every mouse click using the particular effect. For more
options, use the drop down menu on the slide sorter toolbar labeled Text Preset
Animation. On the Animation
Settings dialog box, pick a build
option, a visual and audio effect, and the text color after a build step. In
Slide Sorter View, build icon appear below the slide miniature of a slide with
build but you cannot preview it. For more options, do the following:
·
View your slide in slide view
·
Right click on your slide
·
Choose custom
animation
Saving Your Presentation
To save your
presentation, choose Save As from the File menu. In the
File Save dialog box, type the name you wish to give your presentation in the
File name edit box, select the folder where you want it saved from the Save in
drop down list, and click Save. If
you’re going to open the presentation in another computer and want to make sure that text displays properly,
click the Embed True Type check box.
Opening a Presentation
To begin working with PowerPoint by opening an existing presentation
select Open an Existing Presentation from the PowerPoint startup dialog box and
click OK. If PowerPoint is already
running, choose Open from the File menu or click the Open button on the
Standard Toolbar. From the File Open dialog box, select the folder where the
files is located in the Look in drop down list, select the file from the Name box, and click open.
You can open
several presentations at a time. To
switch between open presentations,
select the file name from the Window menu.
Printing
To
print, choose Print from the File menu. In the Print dialog box, select from
the PowerPoint drop down list the output your want (slides, handouts, notes
pages or outline) and click OK. If you’re printing a color presentation on a
black and white printer, click the Black & White check box to print Black
and White View of the presentation. If your slides are sized differently from
the paper you’re printing on (for example, 35mm or on-screen), click the Scale
to Fit Paper check box to make the slide images fill the page
Getting
Help
To access
online help, select Microsoft
PowerPoint Help Topics
from the Help menu. You can type in a help request in your own words using the Answer wizard as well. And
don’t be afraid of the paper clip, star, Einstein look-a-like, or whatever may
pop up as your assistant. To access any of these options, click on the help
button on the standard tool bar.
***
